Tides are caused by the gravitational effect of the Moon and the Sun. The positions of the Moon and Sun can be predicted many years into the future. Thus the times and heights of the tide can also be predicted many years ahead.
The UKHO (United Kingdom Hydrographic Office) are the main publishers of Tidal Data and they publish four volumes of Tide Tables covering the whole world. They also sell the data to many other publishers such as Reeds and Imray who reprint the Tide Tables in various almanacs.
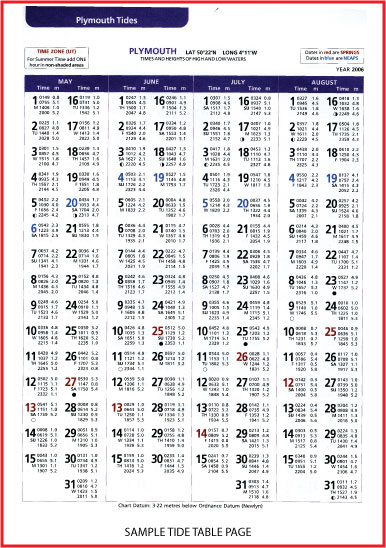
The image to the right shows a page of tide tables from a typical almanac.
Admiralty Tide Tables and most Almanacs present the information in a similar style so becoming familiar with this layout will enable you to read any tide table.
Main features are as follows: Name of Port at top of page, with Latitude and Longitude. Time Zone – UT (Universal Time) = GMT (Greenwich Mean Time). Tide times are given in the official standard time at the place (no adjustment for any Summer Time kept). This Plymouth Tide Tableis printed in GMT (UT). In Tide Tables for Quebec the Time Zone would be +0500, meaning that adding five hours to the tabulated times would give you GMT (UT).
Tide Table page from a typical almanac
TIDE TABLES EXPLAINED
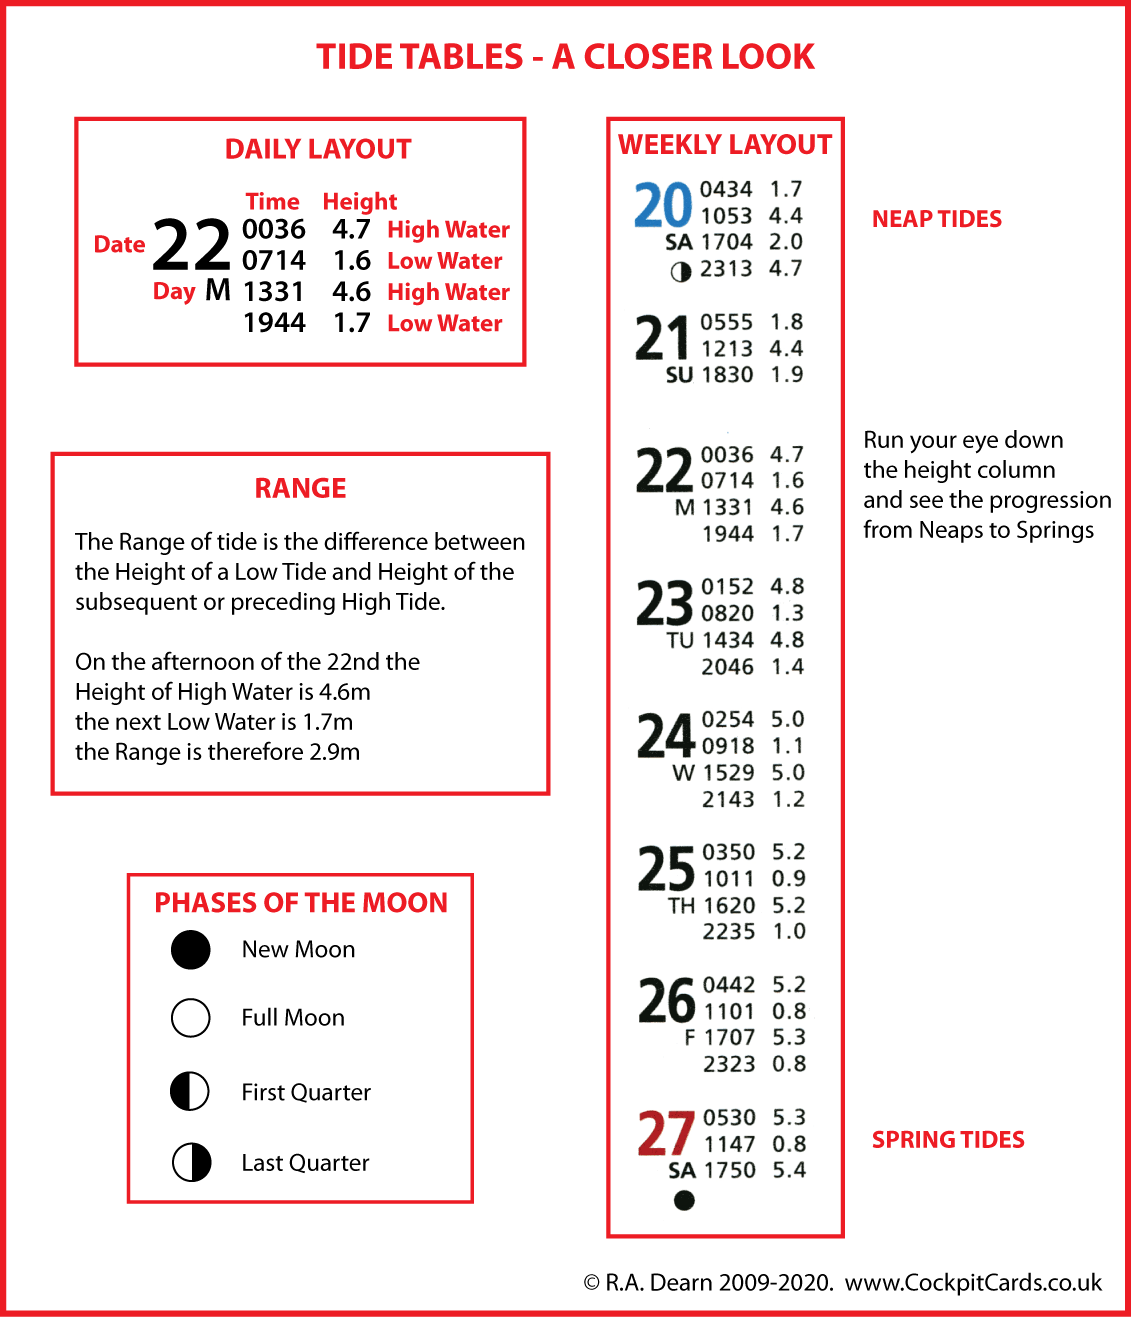
How to read a tide table. The diagram below gives a detailed look at the way the information is presented. As with most navigational information it is clear and logical.
DAILY INFORMATION For each day we have Date and a Letter which indicates the day of the week. The Time is given in the 24hr clock and Height above Chart Datum in metres.
SPRINGS AND NEAPS Spring Tides occur about every 14 days near the Full and New Moon, these are the times of highest high tides and lowest low tides.
Neap Tides occur about 7 days after Springs around the First and Last Quarter phases of the Moon.
RANGE The Range of the tide is worked out by deducting the Height of a Low Water from the Height of a subsequent or Preceding High Water.
THE EFFECT OF BAROMETRIC PRESSURE ON WIND AND TIDE Tide Tables are predictions, and both Barometric Pressure and Wind influence both tide Times and Heights.
Unusually high pressure will depress tidal heights and unusually low pressure has the reverse effect. A 34mb difference from the average can cause differences in height of up to 0.3m. Strong winds also have an effect. Sea levels are raised on a Lee Shore with lower levels on a Weather Shore. Winds under about force 5 will have little effect. These effects are very variable and depend on the topography of the area.